Digital Project 3: Network and concept maps of August Wilson’s plays
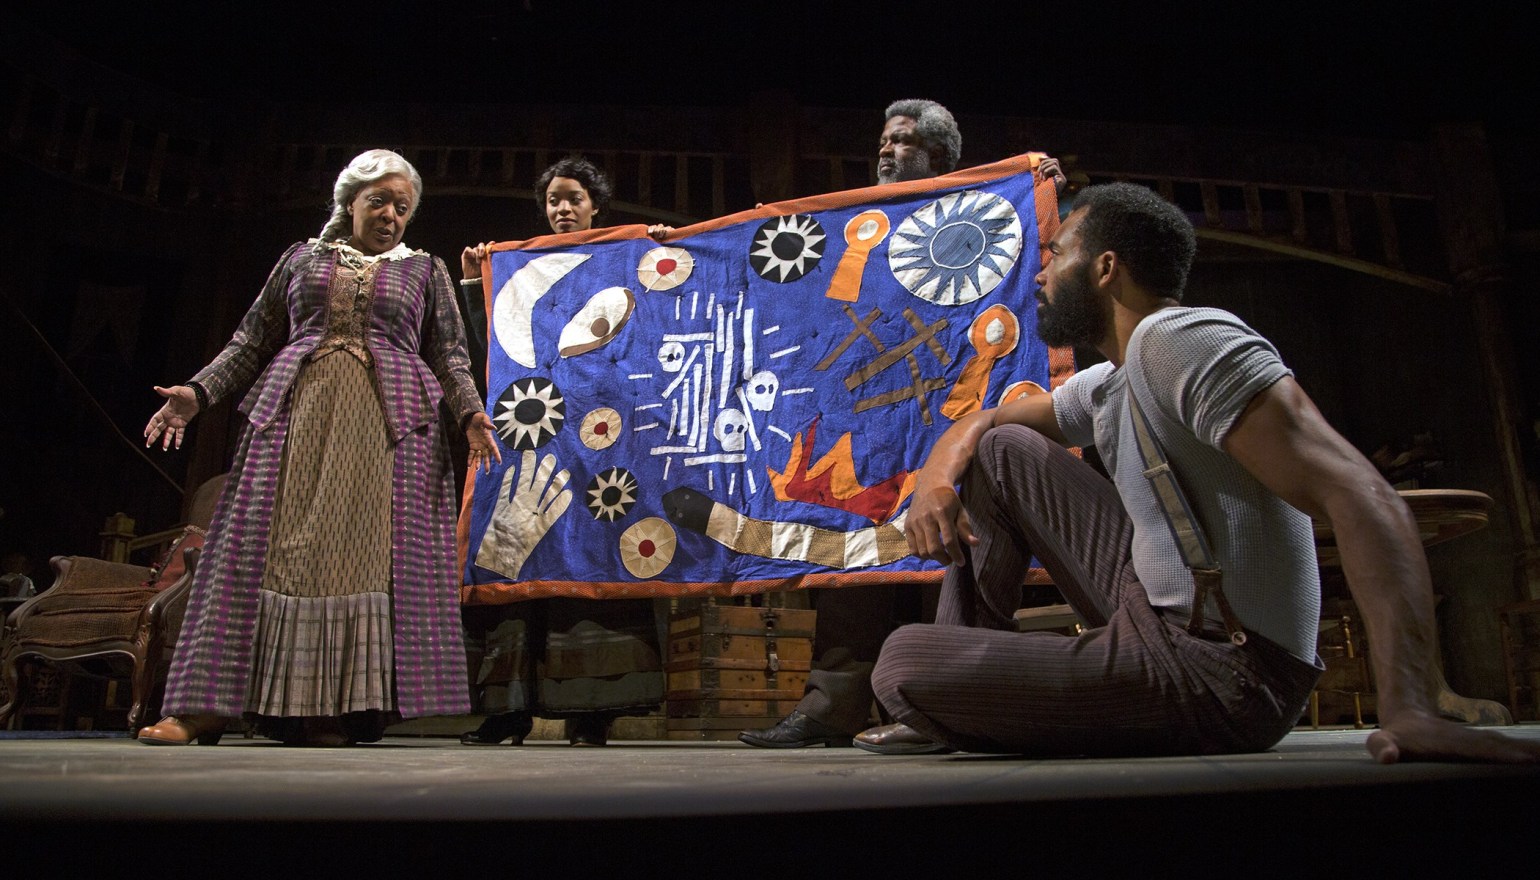 Source: Orange Curtain Review, Orange County CA October-November 2017 production of Gem of the Ocean
This digital project involves creating concept and network maps to help visualize patterns in August Wilson’s plays, Gem of the Ocean and Radio Golf. We will work with Google Sheets again, but in a new way, to organize information about related concepts and map it with Kumu’s free visualization platform. We will get started by setting up free accounts, and we will be exploring how to structure and import data from a published Google Sheet following Kumu’s documentation. The first challenge for us will be determining what kinds of patterns we are interested in visualizing. Each student records and visualizes pattern individually, choosing options, such as:
- Social network: Who is on stage together in the same scenes, and what locations connect characters?
- Material objects and which characters are connected with them
- Symbolic concepts and material objects in the plays
- For example: plot nodes and connections to diagram the journey to the City of Bones.
- Mythic shared identities, with the individuals who share those identities, perhaps with material objects they are associated with
- Historical events and people outside the text who relate to or connect with events in the play
Phase 1:
In class we will start with some planning exercises to set up the columns in Google Sheets and experiment with visualizations.
The Google Sheet will have two tabs, one for Elements and one for Connections. Elements provide basic information on each node you want to map, such as, for Aunt Ester, that she is a person seen on stage, that she is a spiritual leader, and (if you wish) has an image. The Connections sheet records connections Aunt Ester has with others. The visualization can indicate whether she made or received those connections (to give the association a direction from agent to recipient), or whether the connection is simply mutual or shared.
Begin setting it up following my starter template file.
To help give you an idea of how you can build “maps” or networks with the date you are collecting, here are some sample files:
- a sample Google Sheet that I began with a set of data on people and objects on and offstage in the play.
- Here is a network visualization made with the sheet above.
Class directory of links:
Please record links to your Google Sheets and visualization files here. This page (below the directory) also contains detailed advice and codeblocks for customizing your network visualization in Kumu.
Phase 2: Building networks from plays
Once you have worked out how to organize data into columns and customize displays of of your network, work on designing:
- at least one complete and thorough network of elements and connections to represent the complete play, Gem of the Ocean.
- at least one complete and thorough network of a related network of elements and connections (re-using at least some of your types and tags) to represent the complete play, Radio Golf.
Your networks should be developed from Elements with a coherently organized set of Types and Tags, and you should provide images and descriptions for at least the most important nodes. Elements can be anything you find significant: characters (on or offstage), objects on stage, events, locations, shared identities, etc.
You do not have to plot out every kind of relationship imaginable, but choose to follow specific patterns and try to do so completely by finding everything of a kind. (If you are going to comment on character’s connected to stage objects, look at all the stage directions as well as dialogue and make sure you are capturing every object as it changes hands.)
Choose the words you use for the Type and Tags columns with care to help you make an easily readable visualization. It’s best if the categorical words you apply for Types and Tags are reusable at least once. Run the Social Network Analysis function in Kumu to generate metrics to use in sizing your nodes and weighting your connections.
Phase 3: Analysis and Reflection: Essay
Remember that any visualization is going to filter the readings based on what you decided to plot, but you have been in control of the filtering process.
Carefully inspect the networks you have made for these plays, and note patterns that look significant in the relationships you have graphed. Now, survey your visualization. (In the process of doing this, you may want to add some nodes and connections to make sure you have been as complete as you can be in what you decided to show about the plays. You may also want to revise the way you are displaying your graph based on network statistics and the advanced editing options, to change the size and shape of your nodes and edge connections.) If you have updated or changed your links to your Google Sheets or your Kumu graphs, be sure to update your links on our Google Sheet directory.
When you are happy with your data and your visualizations, think about what aspects of the pair of plays stand out to you from reviewing your visualizations. Make these aspects serve as the foundation of your essay. In the opening paragraph of your essay, explain what you chose to represent in your graph and try to assess how completely you have represented what you wanted to show. Explain how you decided to present connections.
Describe at the end of your first paragraph or the beginning of your second paragraph what clusters or patterns stand out to you in your networks. Develop the following paragraphs of your essay by reflecting on how these relate to the the contents of the play, working with passages that help to higlight examples of the connections you are observing.
- Do you think Radio Golf mostly resembles Gem of the Ocean in the kinds of relationships we see, or can we see some clear and interesting differences between the two plays by studying them?
- Are the most connected nodes in one play similar to the most connected nodes in the other play?
- You could choose to concentrate on characters, objects, onstage or offstage locations.
- How wide-ranging are the places located in one play? How do they compare with the other play?
- How about the quantity and kinds of symbolic objects shared between the characters to bring out a point? Are they similar between the two plays, or is one strikingly different from the other in some way?
- You might concentrate on relationships between characters that highlight tension and conflict, and whether these are associated with objects of certain kinds. (What kinds of objects are you seeing in high-tension relationships?)
Choose to concentrate this in any way that seems interesting, and write your essay to guide me through your graph to show me what I need to notice. Use your graphs to direct us back to passages of interest in each play (which you should quote or describe in detail with your book open and cite by page). These passages should help to highlight something important about the social network in each play, or your comparison/contrast of the two plays. Take your paper beyond the graphs you’ve created to help you discuss the contents of the plays. Your paper should probably be 3 to 5 double-spaced pages long, or between 800 and 1500 words.
Write a heading to your paper on the top left corner of page 1, but not appearing on later pages, giving the following information:
- Your Name
- This class: Englit 0066
- Gem of the Ocean links:
- Kumu graph
- Google Sheets
- Radio Golf links:
- Kumu graph
- Google Sheets
- Date of Submission
Upload your paper with your list of links for Digital Project 3 on the Assignments tab in Courseweb by the deadline, 11:59pm on Thursday, March 21.